Debugging workflows
Updated:
As workflow provides end to end business flow mapping, debugging and changing workflow mapping and links is often a business need. In this article we will see how you can investigate the workflow by executing one or more nodes directly within the workflow and inspect the data being fetched or passed to the actions.
APPSeCONNECT workflow works by executing nodes. A node is an execution unit with special meaning such that it can execute a piece of code with a set of input to provide one or more outputs. Except some special nodes, every node takes an input and returns an output.
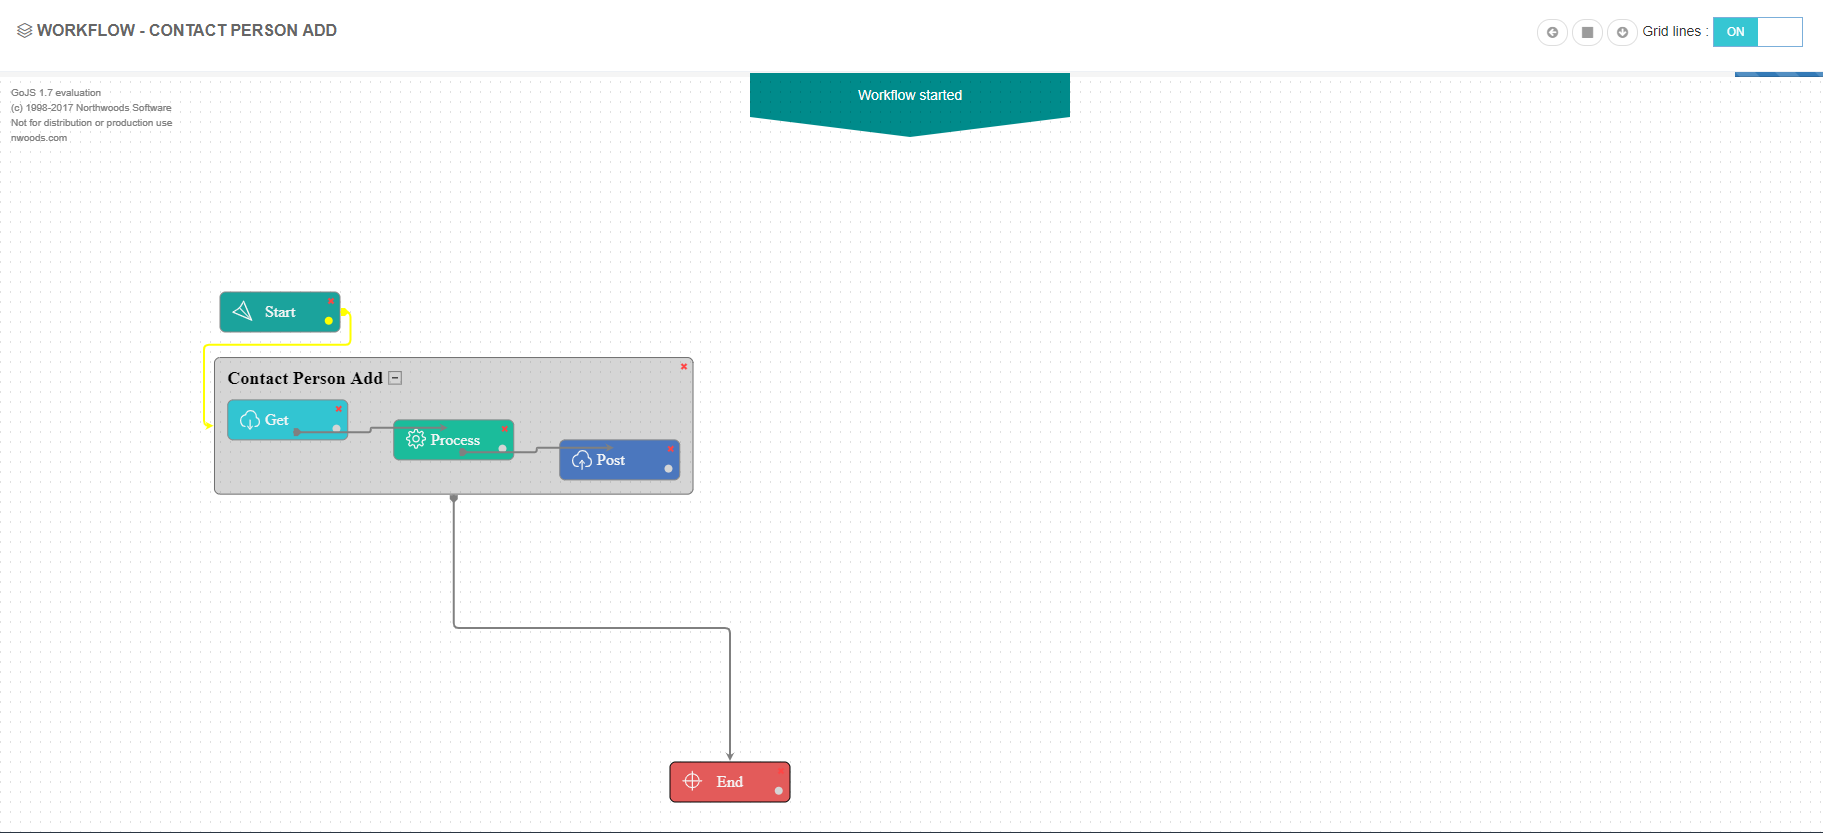
While in execution workflow provides notification about the workflow execution. The node turns yellow during its execution, turns green when there is a success or turns red on failure. You can inspect data, input / output packets and resync bucket during its execution using data inspectors.
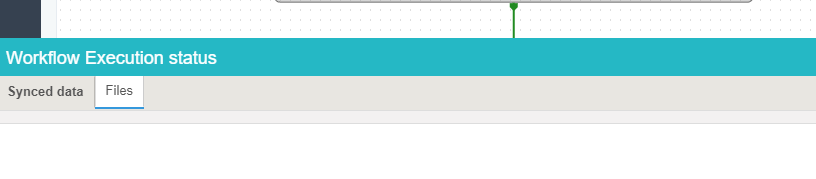
Here the data inspector is having two tabs. One is termed as Synced data which individually tracks each and every data that is being executed during execution and produces a list of data.
On the other hand, it will also list the number of files which are being transferred by the node. You can click on the file link to get the actual data which is being executed.