Data view of Snapshot
Updated:
Snapshot in processflow gives complete overview of the transactions that was executed. A transaction in processflow defines an execution of the business flow at that instance. Every processflow will be able to execute more than one integration, which depends on logic defined on the designed processflow, dependencies specified, or even based on data volume. The snapshot gives a detailed overview of the data that is being transferred through processflow giving you a complete picture of the data transformed through the sync process. The snapshot gives tracing over the data transferred through integration. You can investigate the Data Log, Transaction files & the Activity Log for each process execution. After a successful execution, you can view the snapshot listing on the multiple time execution of the processflow.
Pre-requisites for viewing Snapshot
- You should have valid credentials to the portal.
- You need to create a processflow for generating a snapshot.
- The environment where the processflow needs to be executed should be active.
- The created processflow needs to be deployed to the environment successfully.
- You need to execute the processflow for generation of the Snapshot.
Note : You can only view the successful data for every instance of generated snapshots.
Steps to view the ProcessFlow Snapshot
To view the snapshot of a processflow that has been executed, you need to follow the procedures. Given below are the steps that will help you view Snapshot of a processflow that is executed.
- Login to Portal and Navigate to the Deploy > Environment for viewing the Snapshot of the executed processflow.
Note : You need to have the environment active for viewing the details page. - Click ProcessFlows Tab. You can view the list of all the deployed processflows. Following are the details that will be displayed for each deployed processflows.
- Name of the processflow
- The time of Deployment
- No of Tries
- Status of Deployment
- Actions
- Click Ellipses button (…) available beside the processflow that you have executed. You can view the option
View Snapshotin the context menu.
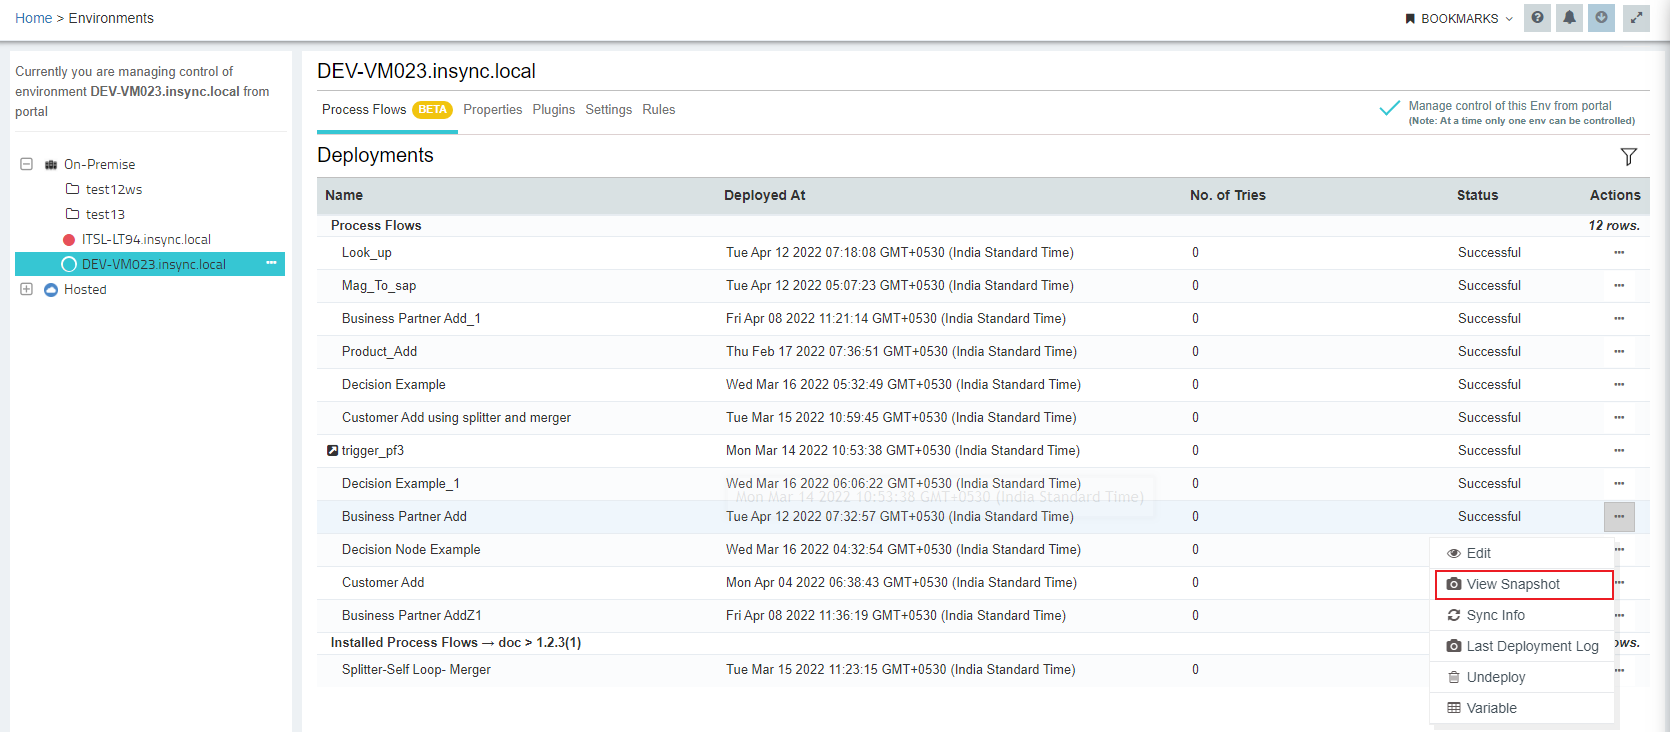
- Click
View Snapshotbutton to view the Snapshot. The Snapshot will display the following details of the processflow.
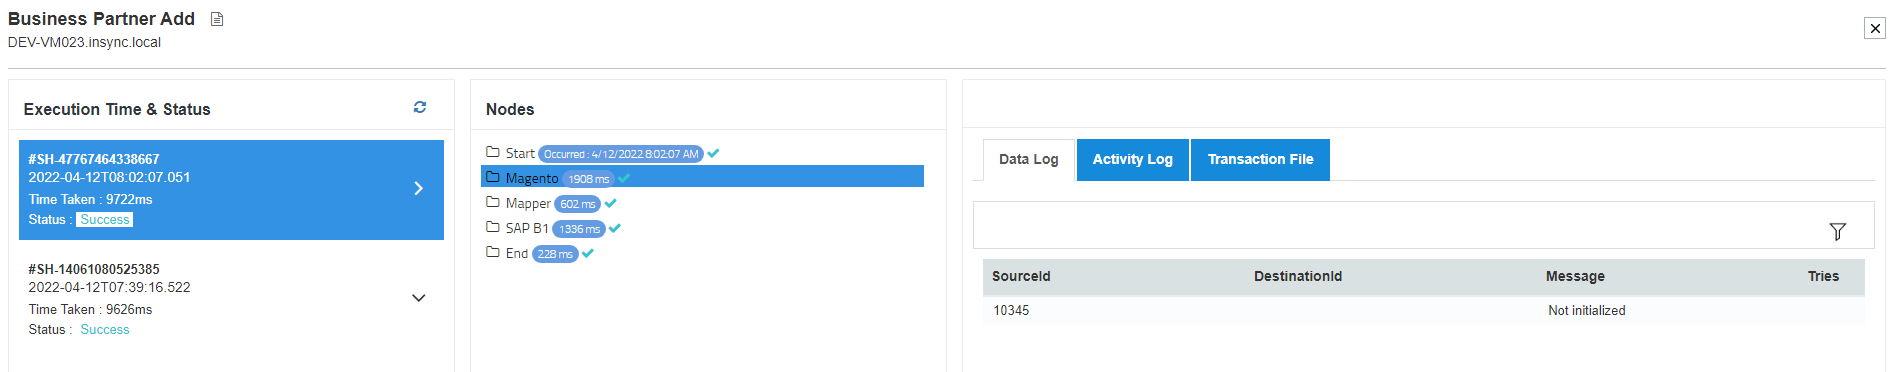
- ProcessFlow Name - Displays the name of the processflow on the left corner of Title bar of the Snapshot pop-up window.
- Environment Name - Displays the environment name on which the processflow is executed.
Note : You need to hover over the processflow Name & Environment Name to view the name if it exceeds 100 characters. - Document Icon – You can view the description of the processflow by hovering the Document Icon beside the processflow Name.
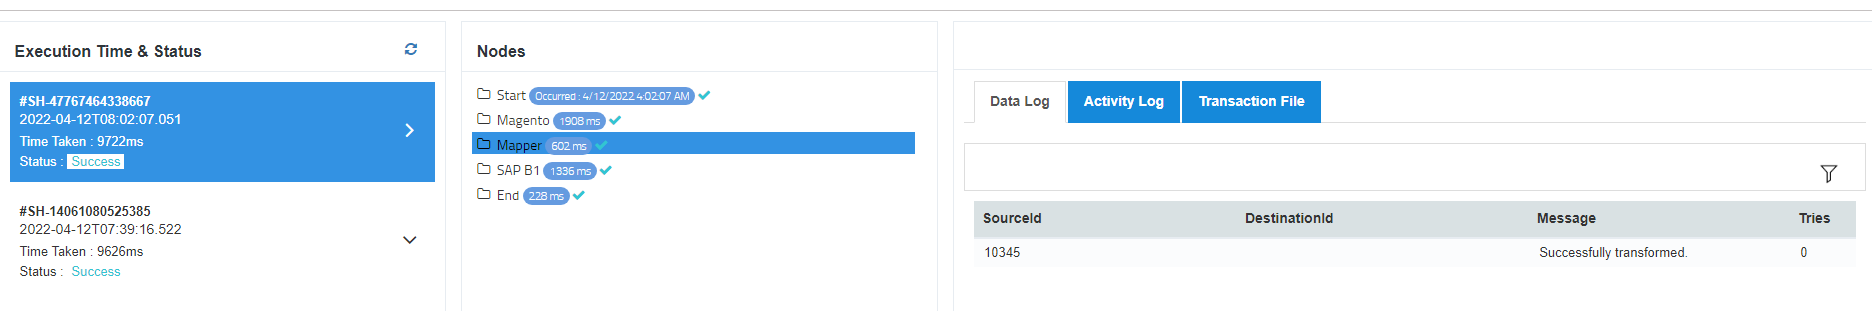
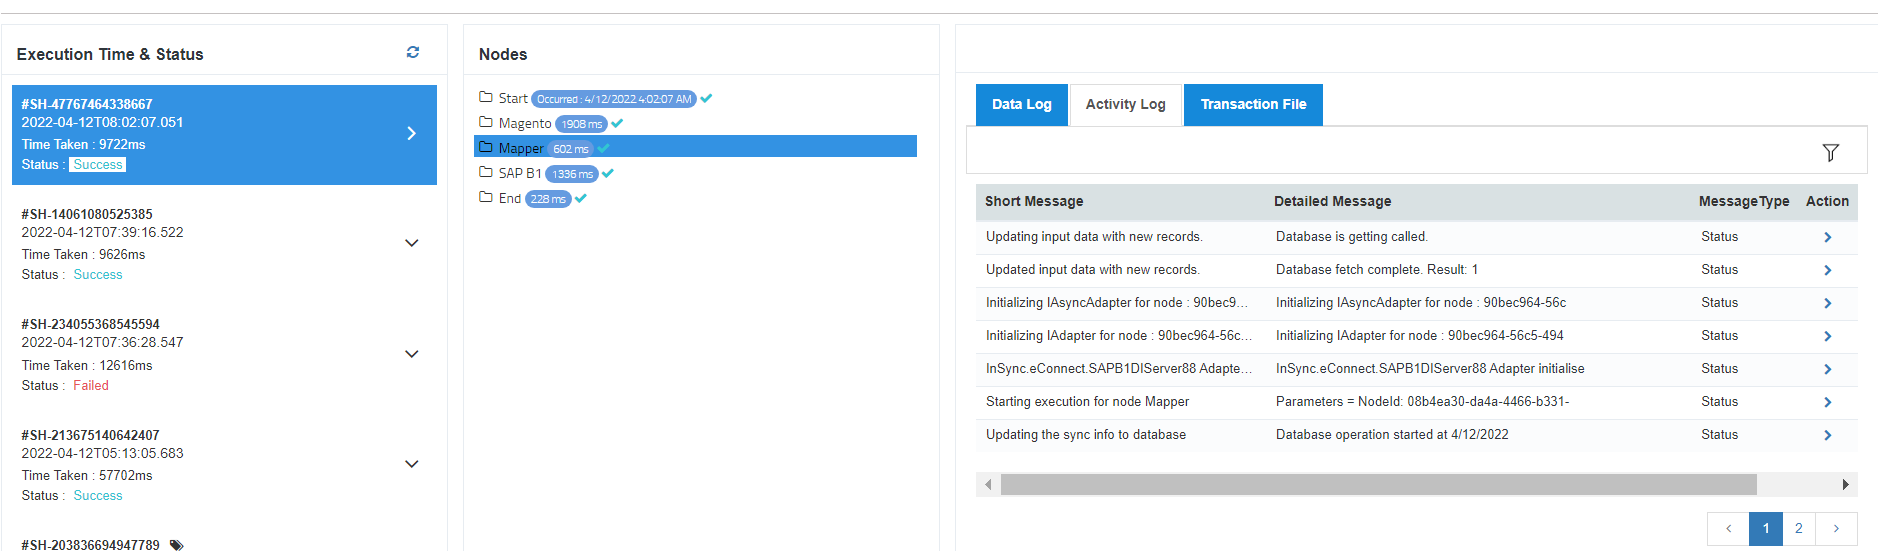
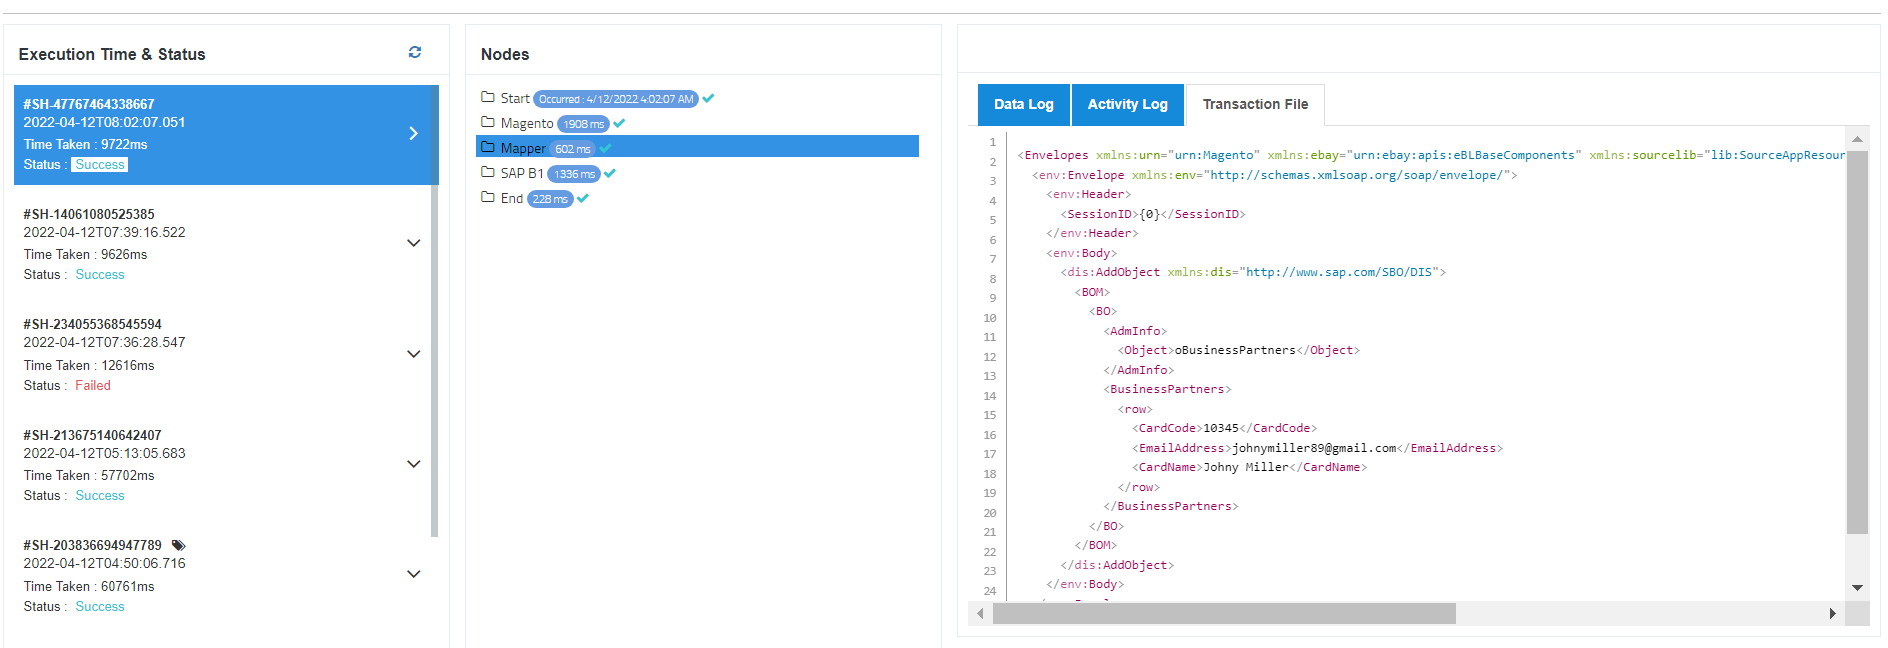
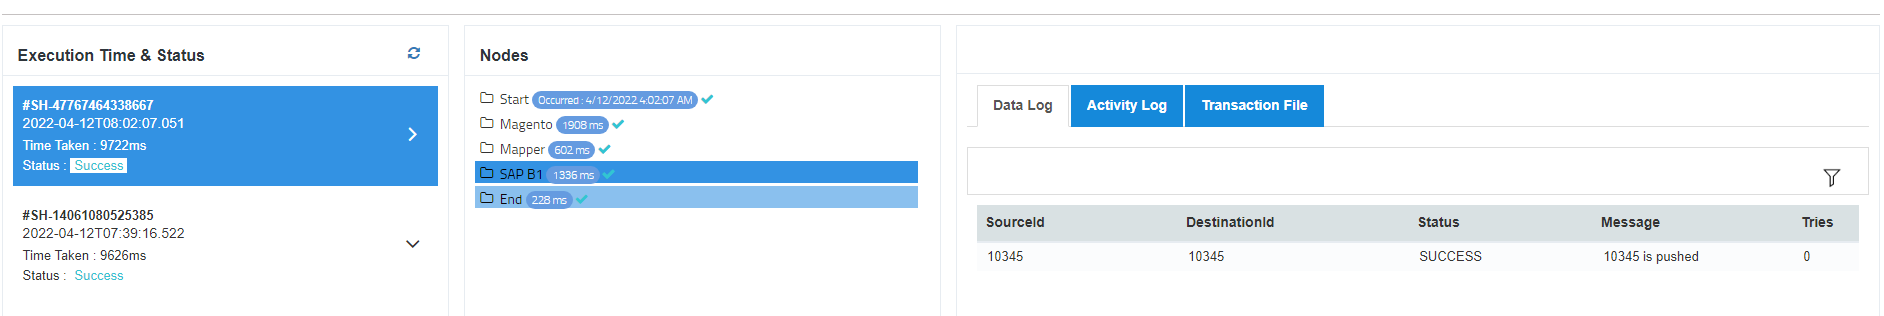
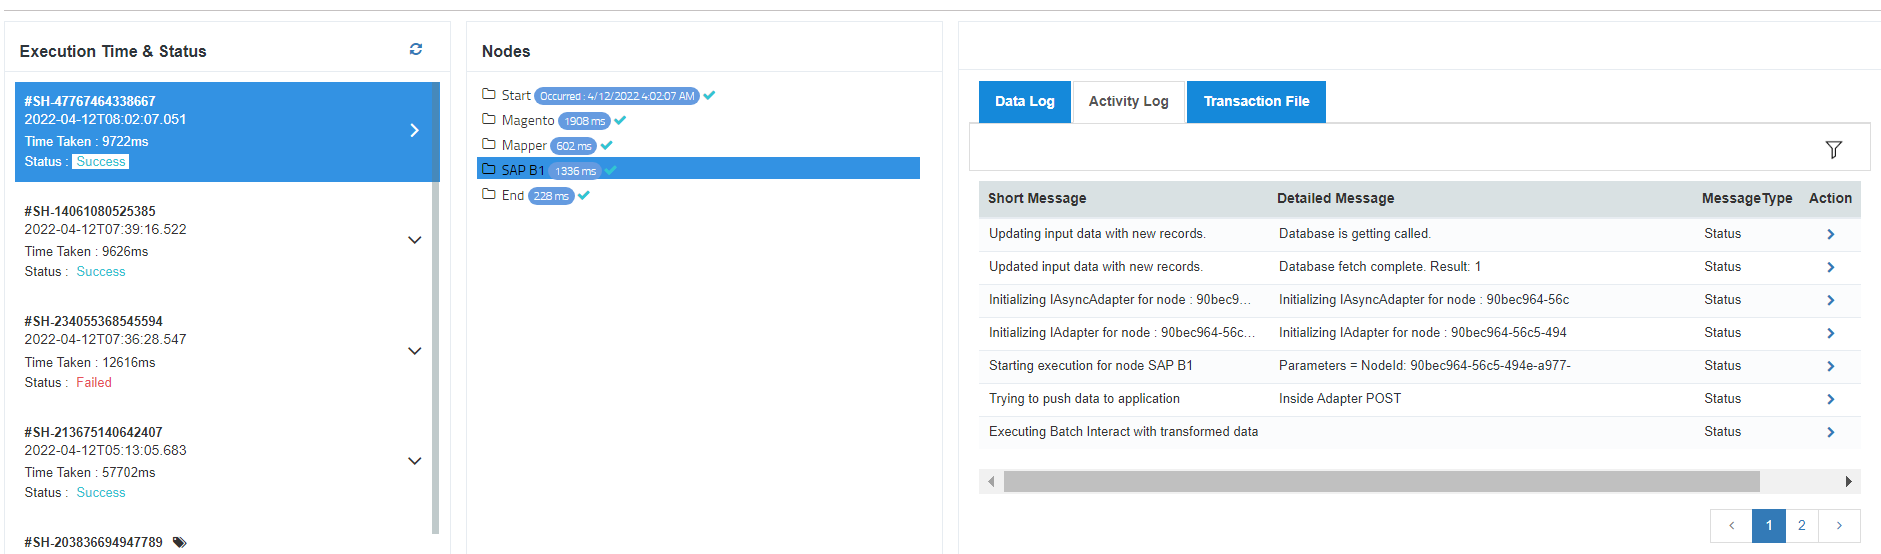
- Execution Time & Status - Shows all the Snapshot files with respect to the execution Time & execution Status. You can view the files on the Left side of the Pop-up window. For every Execution Time & Status, you can view the following details.
(a) Serial Number
(b) UTC Time of its execution
(c) Time Taken to generate the Snapshot
(d) Status of the execution process
Note : You can view 10 snapshots at a time based and status however you can click on the More button to view the next 10 snapshots that has been executed in the past. - Nodes Panel : You can view the nodes that were executed in the processflow. Clicking on individual Execution Time and Status files (available on the left), will display all the nodes that were executed for that execution time.
- Node Details Panel : This panel will display the node specific execution details for each node mentioned as below.
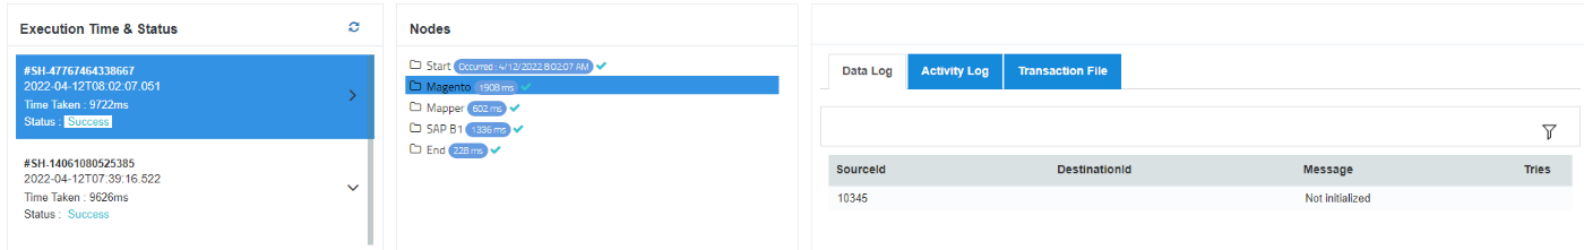
(a) Data Log - Displays the identity of the data for each node executed. The id is displayed based on the Primary key of that node.
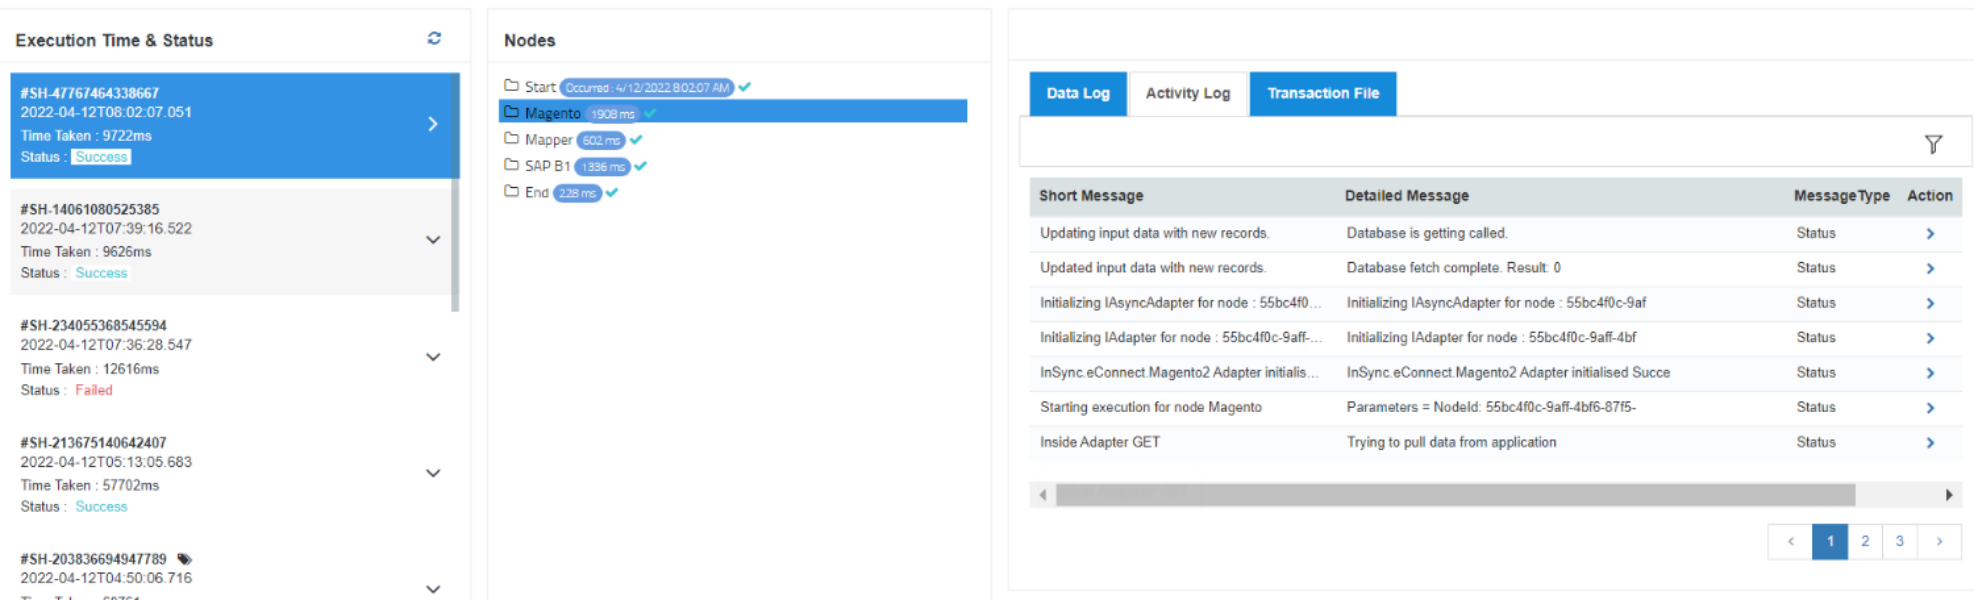
(b) Activity Log – This tab will display the execution logs of each node.
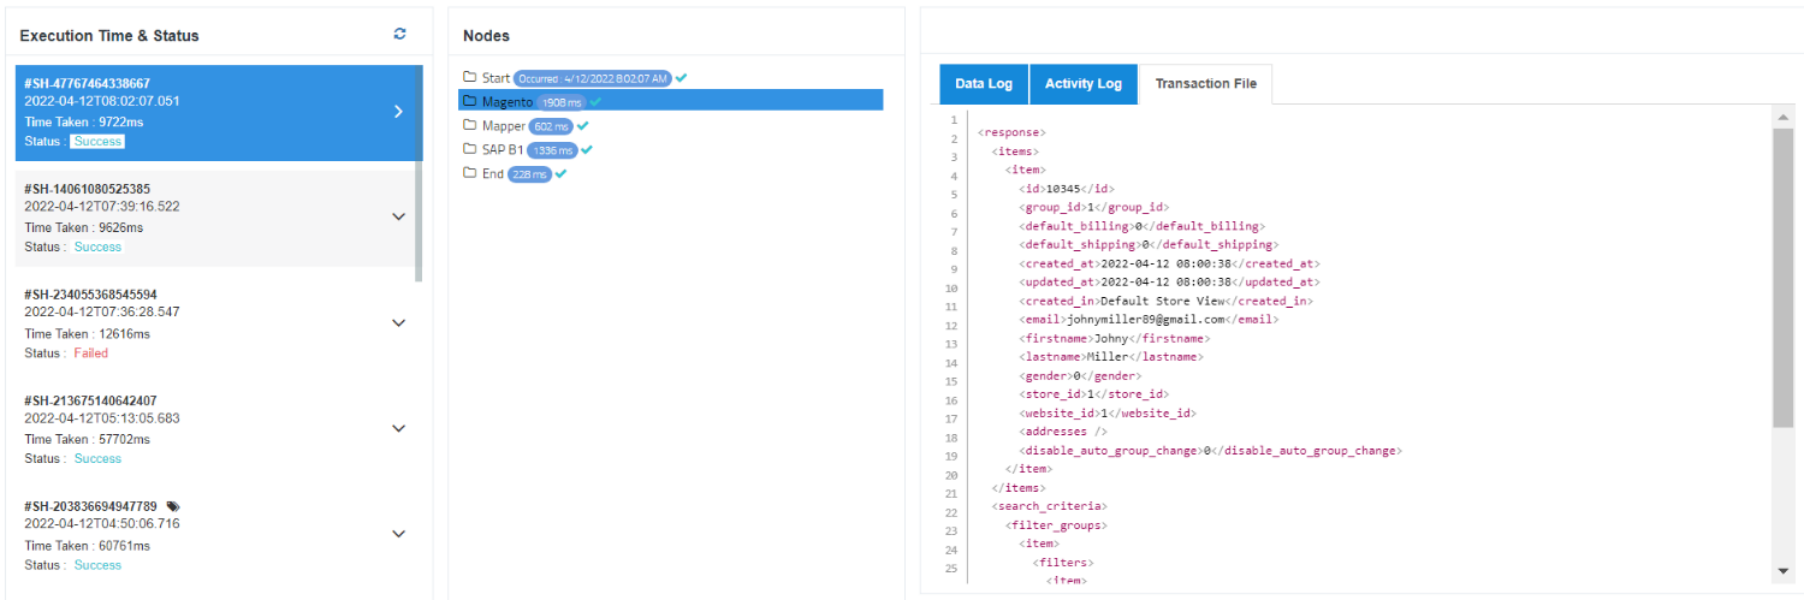
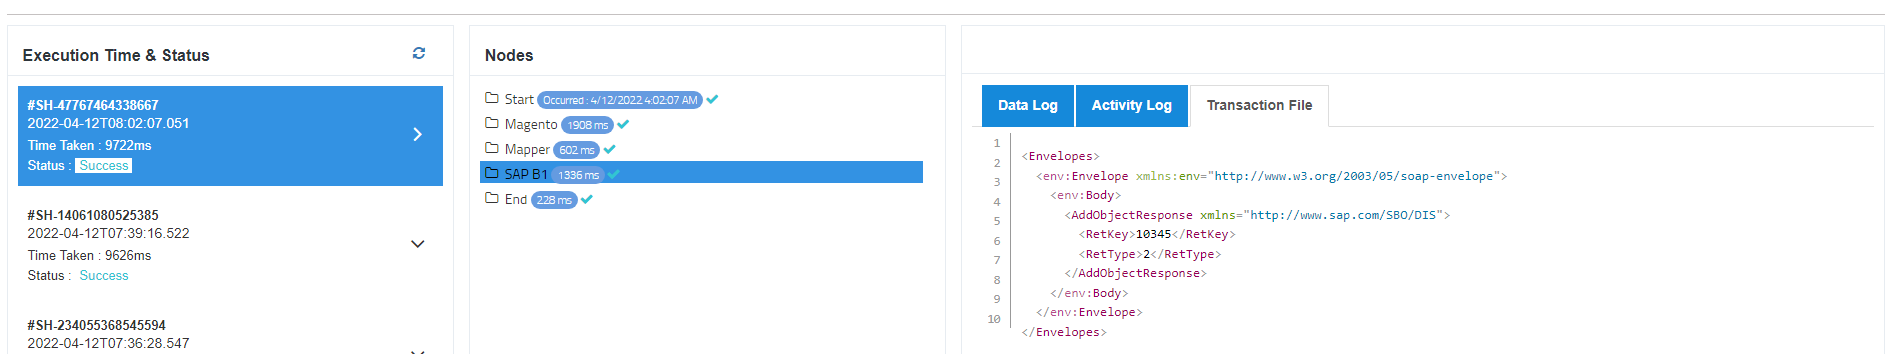
(c) Transaction file – Displays the data packets generated after executing the selected node.
- On the Right Panel, you can view the list of snapshot files based on Execution Time & Status. Clicking on any of the instance, you can view the node specific details of the execution for that instance. The latest snapshot will be listed first.
- Click on the Start Node. You can only view the Activity logs Tab for the Start node in the Right panel.
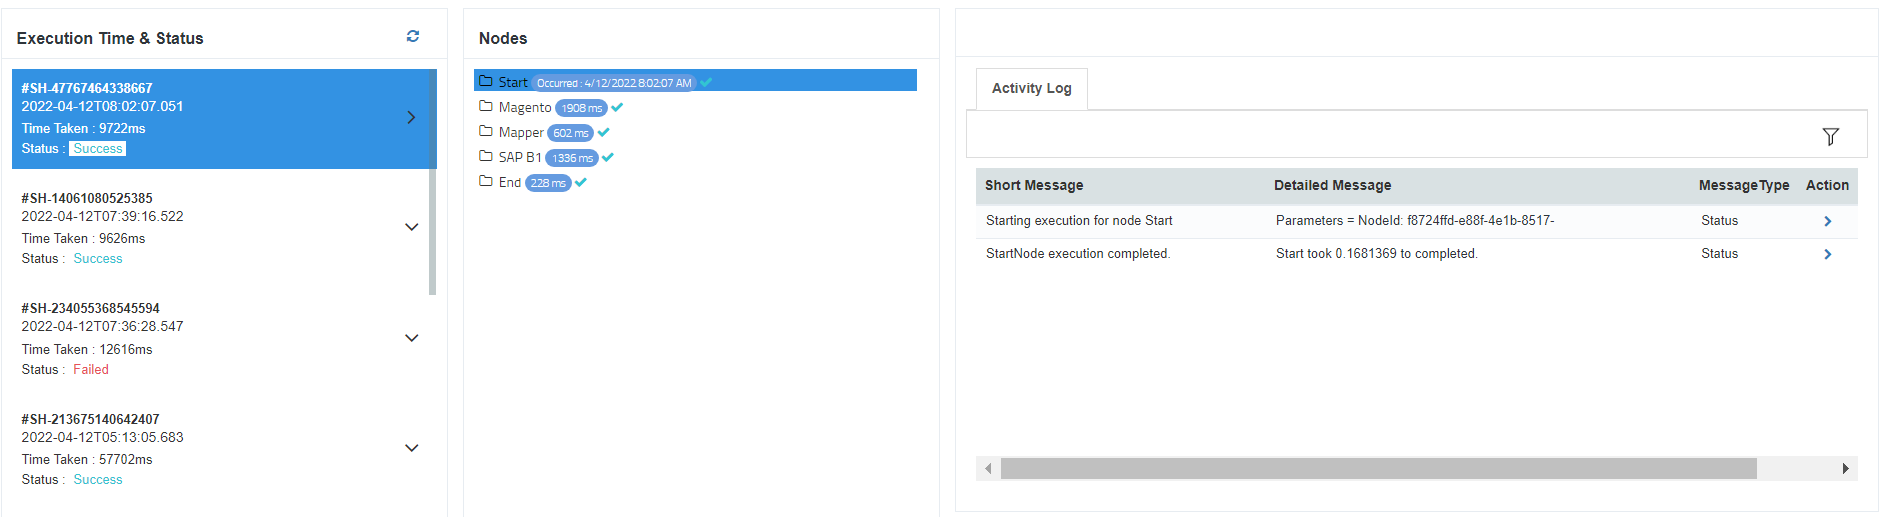
You can also view the UTC time of its execution.
Note : The selected node would be displayed with the font colour blue.
Node Specific Snapshot View
You can view node specific results based on the status of the Execution. You will also be able to view the time taken for executing the specific nodes. The key for denoting the node execution status is :
- Green - Denotes with a tick icon for successful execution of that node.
- Red – Denotes with a cross icon for failed execution of the node.
You can view the Node specific view of the Snapshot in the scenarios given below :
1. Scenario : Get Node
a. Click on the Get Node. You can view the snapshot results for all the three tabs – Data Log, Activity Log & Transaction File.
b. Click on the Data log tab of the GET node. You will be able to view all the data that are fetched from the Source Application.
 Following are the details that would be displayed for each data in Data Log.
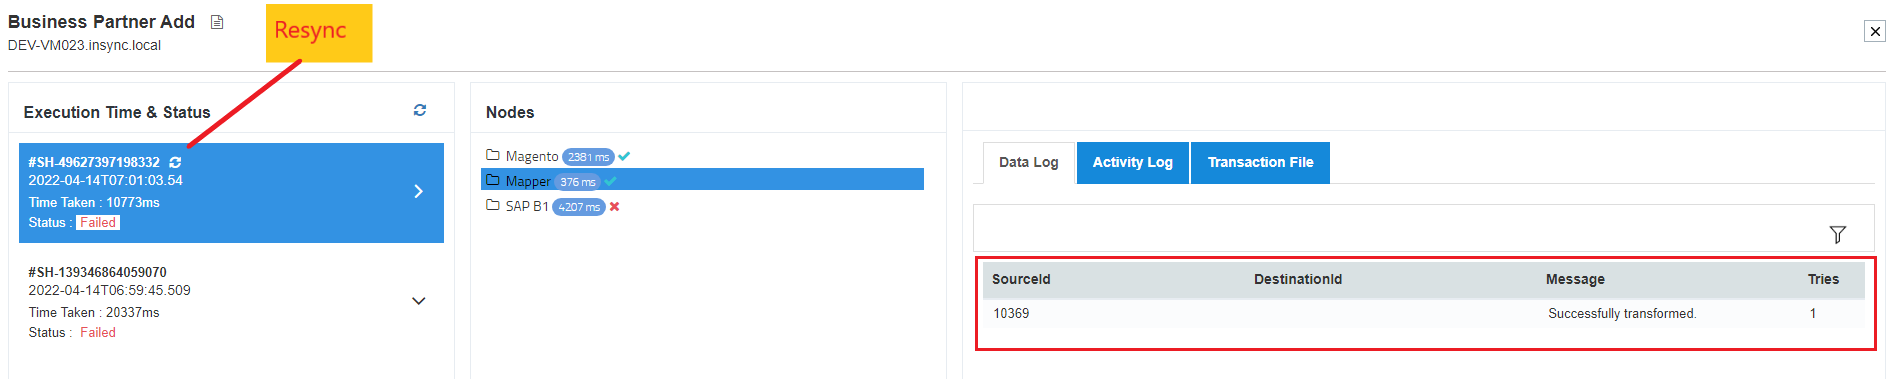
- SourceId - This is the primary field for representing the data, synced. It can either be an Email id or Data Id or the Data name, depending on the entity of the Application.
- DestinationId - GET Node will not generate Destination ID in Snapshot.
- Message - You will be able to view execution specific message with respect to individual data.
- Tries - You will be able to see the count of the number of Retries made for each data.
The Data Log view remains same for the nodes – GET, Mapper & POST node.
c. Click on the Activity Log tab of the GET node. You will be able to view the execution log of that node.
 d. Click on the Transaction File tab of the GET node. You will be able to view the input files generated after its execution.
2. Scenario : Mapper Node
a. Click on the Mapper Node. You can view the snapshot results for all the three tabs – Data Log, Activity Log & Transaction File.
b. Click on the Data log tab of the Mapper node. You will be able to view all the data that are fetched from the Source Application.
c. Click on the Activity Log tab of the Mapper node. You will be able to view the execution log of that node
d. Click on the Transaction File tab of the Mapper node. You will be able to view the input files generated after its execution.
3. Scenario : Post Node
a. Click on the Post Node. You can view the snapshot results for all the three tabs – Data Log, Activity Log & Transaction File.
b. Click on the Data log tab of the Post node. You will be able to view all the data along with its status that are successfully posted to Destination Application.
c. Click on the Activity Log tab of the Post node. You will be able to view the execution logs of POST node.
d. Click on the Transaction File tab of the Post node. You will be able to view the Output files generated after its execution for the POST node.
Note : You can only view the successday for every instance of generated snapshots. Failed data will be display in the Retry Window.
Following the above steps, you can successfully view the snapshot of an executed processflow.
Types of Snapshot
The Snapshots are marked based on the type of execution. The Type defines how the snapshot got executed during the process of integration. There are three types of Snapshots present in APPSeCONNECT.
- Manual/ Scheduled Snapshot : In this case there will be no mark shown just beside the snapshot. All the above snaps showing a normal snapshot.
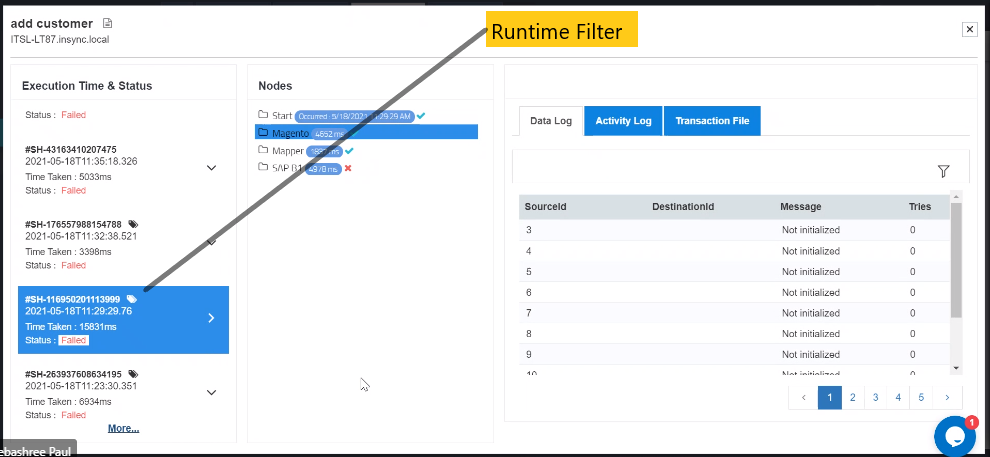
- Retry Snapshot : If an integration is retried by an user, the snapshot getting generated will show the retry snapshot. Here in the image below, the retry snapshot is getting demarked.
- Runtime Snapshot: In case if a custom action filter is used to execute an integration manually, the snapshot will show a special symbol marking the Runtime filter.